Gameplan Project Tracking |
|


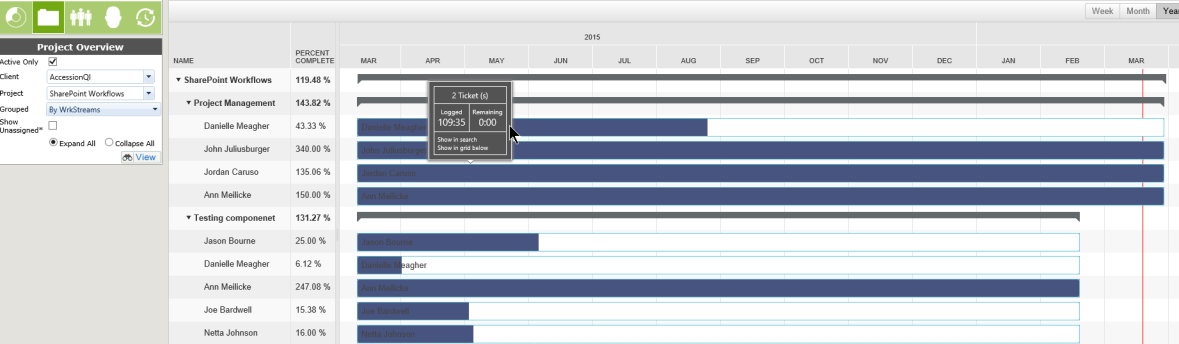
The Overview provides a Gantt chart view by Week, Month or Year. You can group by Workstreams or person, and the view includes the percentage completed for the various Workflows. If you hover over the resource, you will see a pop up with the number of tickets for the resource for the Workstream and the hours logged to date versus the hours remaining. From that pop up, you will also have the option to show the associated tickets in a Search page or in a grid below the chart.